What is Projects Insights Edge?
Projects Insights Edge is a powerful tool designed to analyze your Jira projects, providing both basic and advanced metrics. It helps you understand the health of your projects and identify actionable steps to improve and advance them.
Dashboard Overview
When you open the Projects Analysis Dashboard, you are presented with a comprehensive view of your project landscape:
-
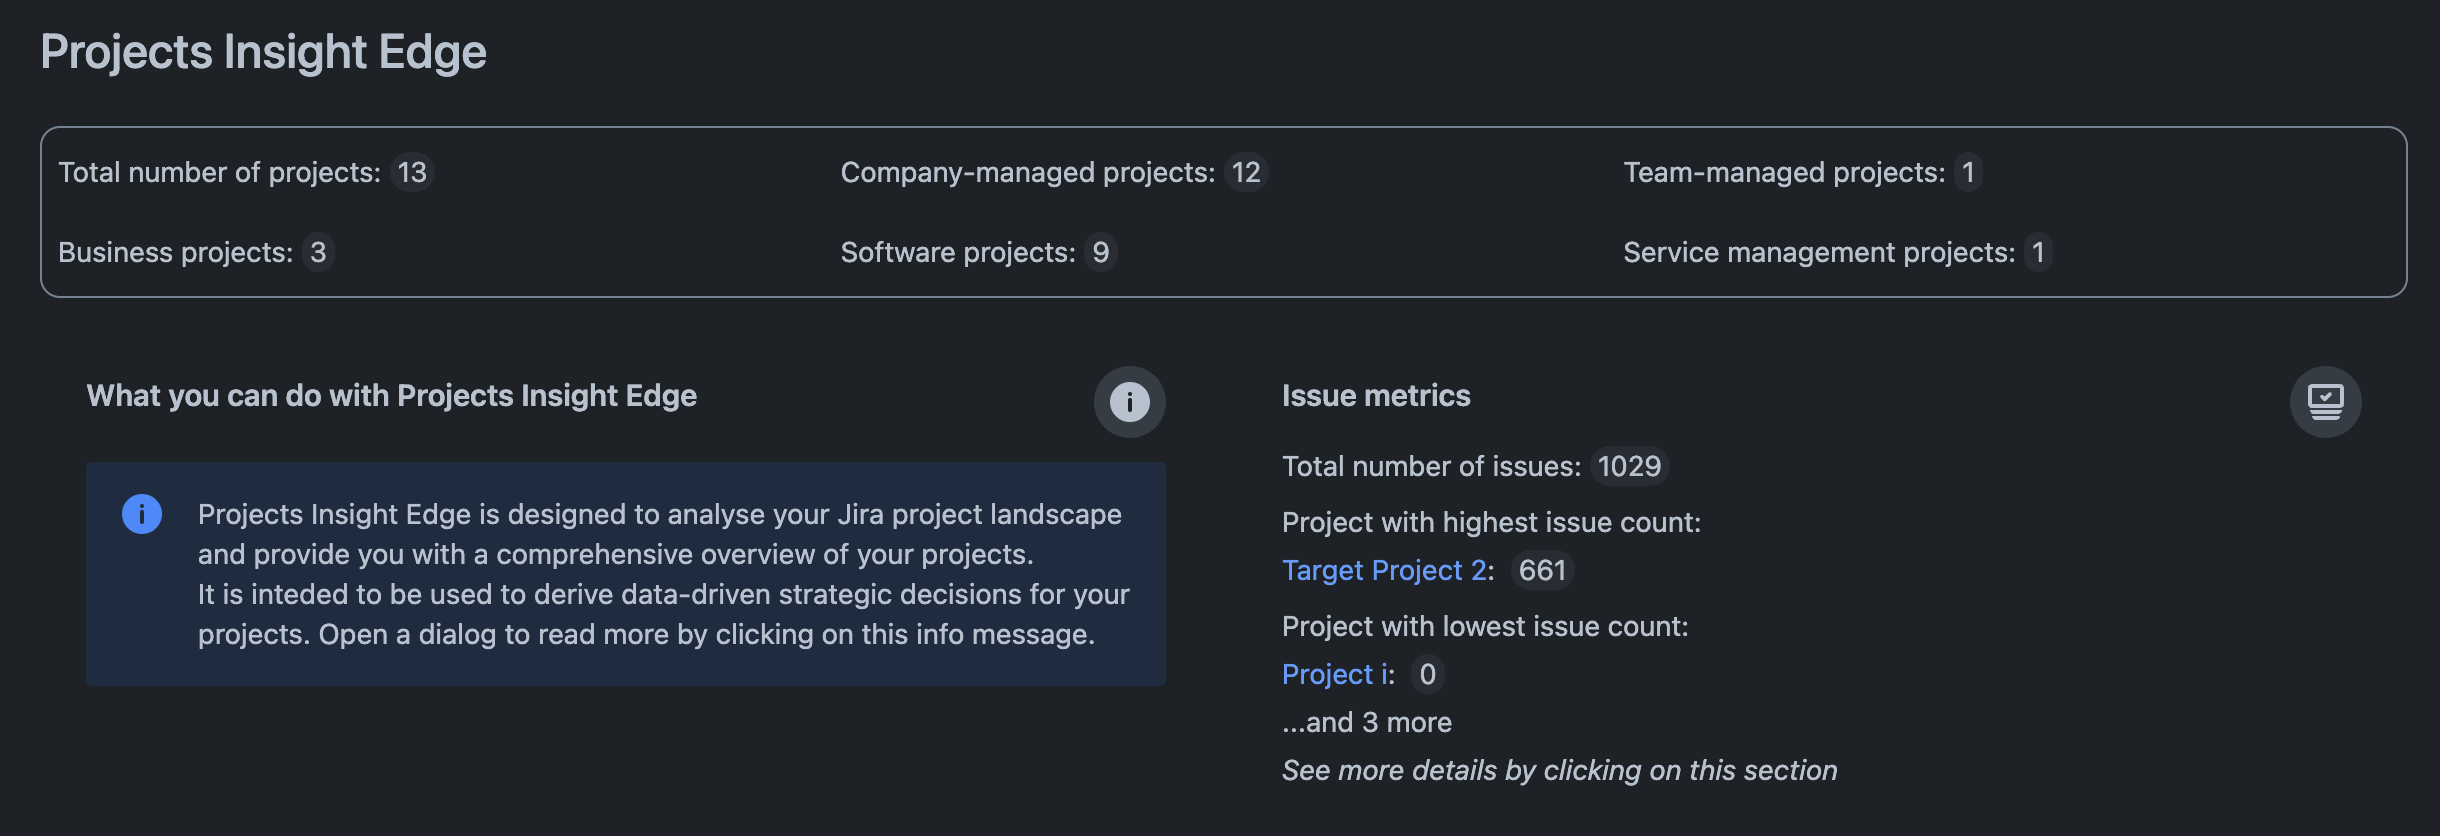
Basic Metrics: At the top of the page, you will find basic metrics such as the total number of projects and their types.
-
Issue Metrics: On the right side, you will see metrics like the total issue count, projects with the highest and lowest issue counts, and details about the last issue updates in projects.
Running a Detailed Analysis
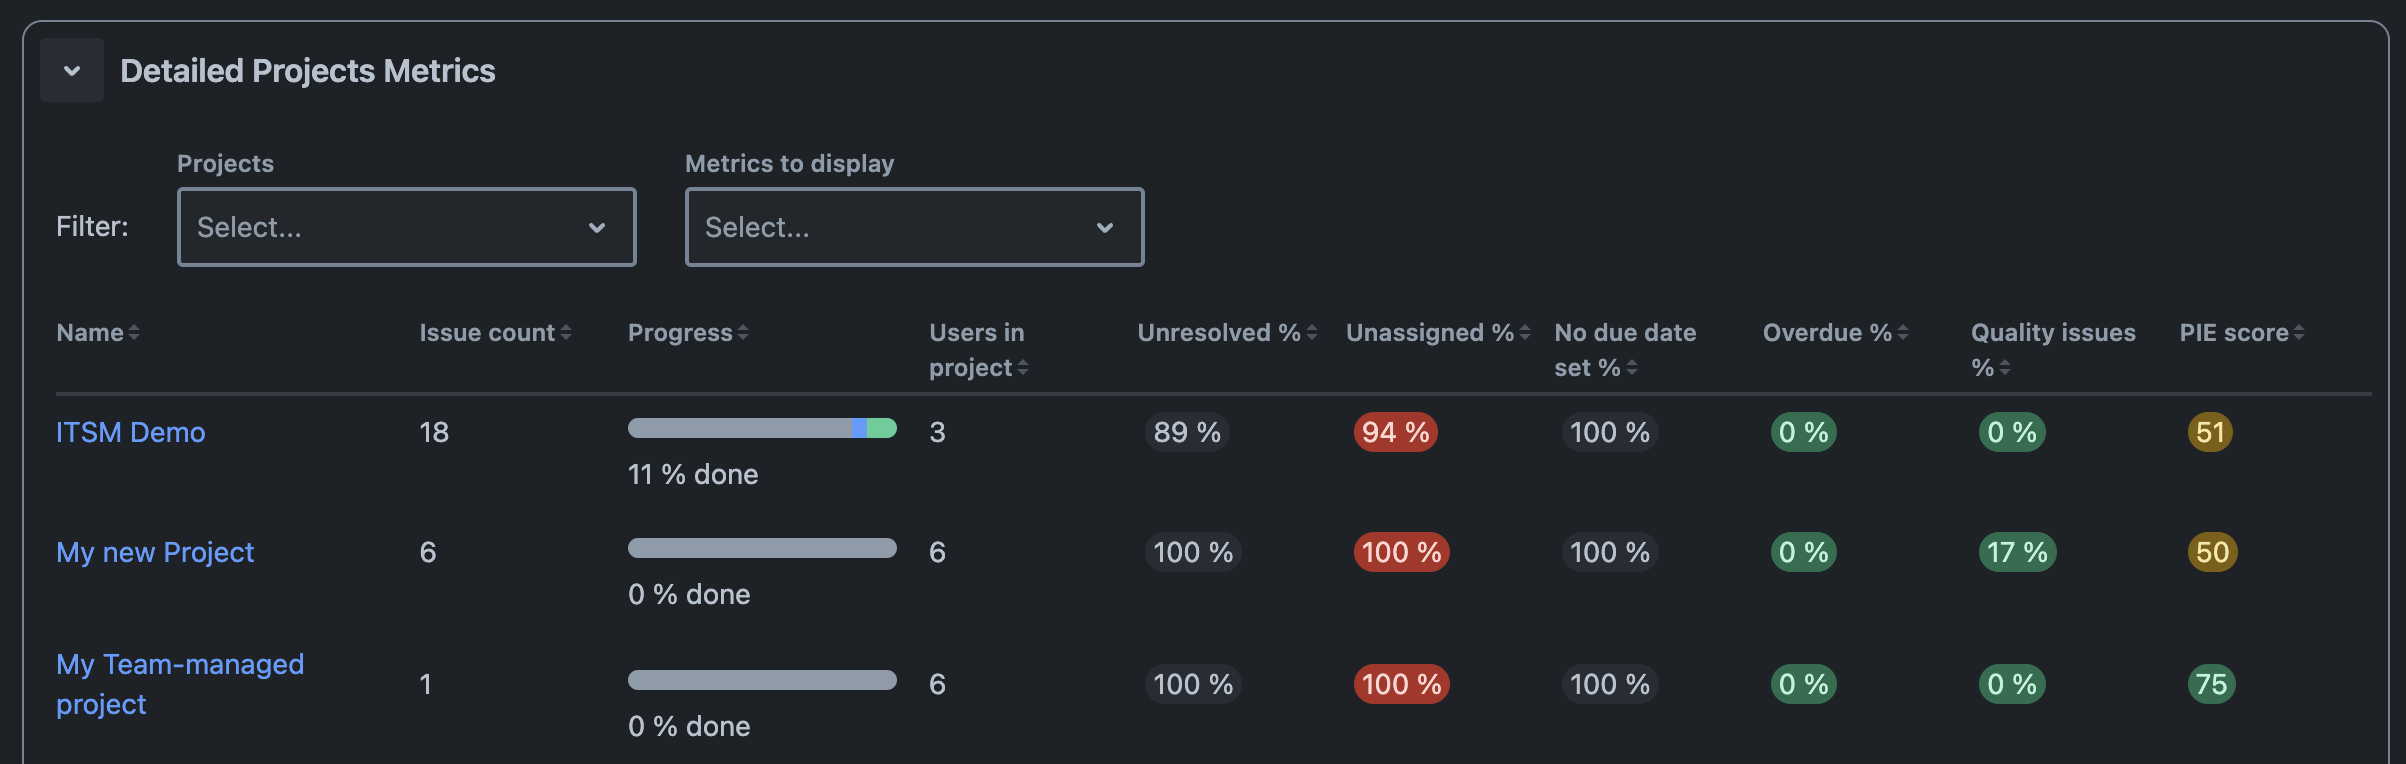
By clicking the 'Analyze' button, you can perform a detailed analysis of your projects. This analysis includes:
-
Total Issue Count: The total number of issues per project.
-
Progress Metrics: Breakdown of issues into To Do, In Progress, and Done.
-
User Access: Number of users with access to each project.
-
Unresolved Ratio: Ratio of unresolved issues to total issues.
-
Unassigned Ratio: Ratio of unassigned issues to unresolved issues.
-
No Due Date Ratio: Ratio of issues without a due date to unresolved issues.
-
Overdue Ratio: Ratio of overdue issues to unresolved issues.
-
Quality Issues Ratio: Ratio of quality issues (e.g., bugs) to unresolved issues, configurable by admins.
-
PIE Score: A comprehensive score reflecting project health, calculated from several key metrics.
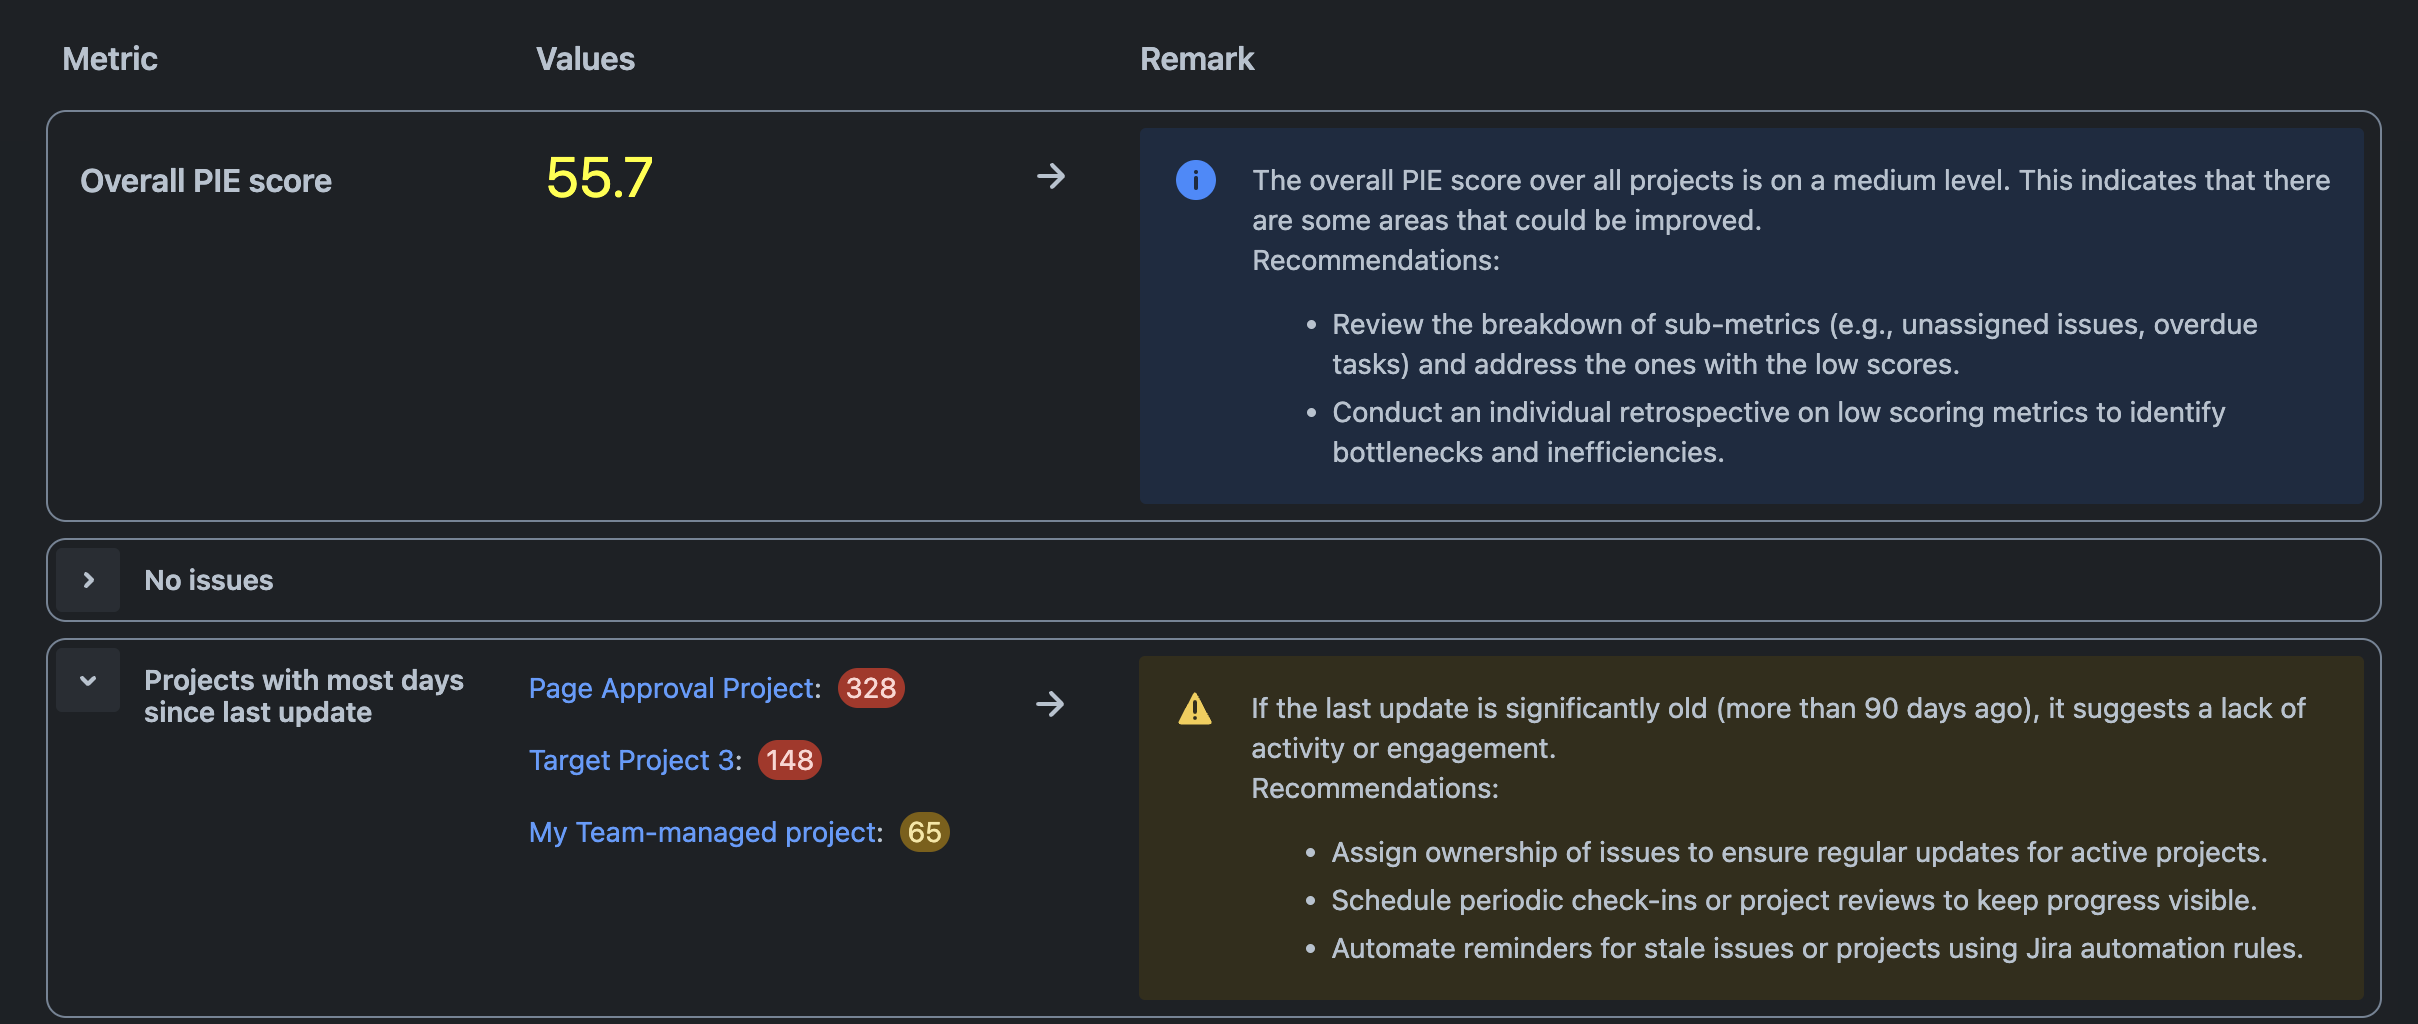
Understanding the PIE Score
The PIE Score (Projects Insight Edge score) is a numerical representation (0 to 100) of a project's health, calculated using:
-
Unassigned Score: Reflects the percentage of unassigned issues.
-
Overdue Score: Reflects the percentage of overdue issues.
-
Quality Score: Based on the percentage of quality issues.
-
Users in Project Score: Ratio of active users to open issues.
Each metric is weighted and combined to form the final PIE Score, which is normalized to a 0–100 range. Thresholds categorize scores into High, Medium, and Low ranges, guiding users on areas needing attention.
By understanding these metrics and the PIE Score, users can make informed, data-driven decisions to enhance project health and performance.